Monday 3 December 2012

It's just the way I Roll...

This is data from Quebec on the number of children born every day. As you can see it's quite messy. There's alot of data in that plot, over 5000 day's figures.

By applying a 30 day rolling average a clear seasonal pattern emerges.

A 365 day rolling average produces a much more clear long term trend than either the daily or 30 day rolling figures.
 
Data: Number of daily births in Quebec, Jan. 01, 1977 to Dec. 31, 1990 from here.


Saturday 1 December 2012

ChRistmas with extRa R - XML & xtable

I like the R blog is.R(). They're doing an Advent CalendaR this Christmas looking at an R package everyday up until Christmas Eve. I thought I'd play along. Instead of doing exactly the same as them and using the US presidential election results I'll do a variation on a theme and scrape the last UK general election results data from Wikipedia.

> require(XML)
> myURL <-"http://en.wikipedia.org/wiki/United_Kingdom_general_election,_2010"
> allTables <-readHTMLTable(myURL)
> str(allTables)
#List of 29..... I just want the 11th
> stateTable <- allTables[[11]]
> head(stateTable)
#used the data editor in RGui to tidy it up a little
> fix(stateTable)
#Need to remove the first column as I'm not bothered about the #colours and adjust some on the column names
> stateTable <- stateTable[,-1]
> names(stateTable)
> colnames(stateTable)[7] <- 'Net Change in Seats'
> colnames(stateTable)[10] <- 'Change in % of Votes'
> require(xtable)
> resultsTable<-xtable(stateTable)
> print(resultsTable, type="html"))


Political Party Candidates Number of Votes Elected Seats Gained Seats Lost Net Change in Seats % of Seats % of Votes Change in % of Votes
1 Conservative 631 10,703,654 306 100 3 +97 47.1 36.1 +3.7
2 Labour 631 8,606,517 258 3 94 -91 39.7 29.0 -6.2
3 Liberal Democrat 631 6,836,248 57 8 13 -5 8.8 23.0 +1.0
4 UKIP 572 919,471 0 0 0 0 0 3.1 +0.9
5 BNP 338 564,321 0 0 0 0 0 1.9 +1.2
6 SNP 59 491,386 6 0 0 0 0.9 1.7 +0.1
7 Green 310 265,243 1 1 0 +1 0.2 0.9 -0.2
8 Sinn Féin 17 171,942 5 0 0 0 0.8 0.6 -0.1
9 Democratic Unionist 16 168,216 8 0 1 -1 1.2 0.6 -0.3
10 Plaid Cymru 40 165,394 3 1 0 +1 0.5 0.6 -0.1
11 SDLP 18 110,970 3 0 0 0 0.5 0.4 -0.1
12 Conservatives and Unionists 17 102,361 0 0 1 -1 0 0.3 -0.1
13 English Democrats 107 64,826 0 0 0 0 0 0.2 0.2
14 Alliance 18 42,762 1 1 0 +1 0.2 0.1 0.0
15 Respect 11 33,251 0 0 1 -1 0 0.1 -0.1
16 Traditional Unionist Voice 10 26,300 0 0 0 0 0 0.1 N/A
17 Speaker 1 22,860 1 0 0 0 0.2 0.1 0.0
18 Independent - Rodney Connor 1 21,300 0 0 0 0 0 0.1 N/A
19 Independent - Sylvia Hermon 1 21,181 1 1 0 +1 0.2 0.1 N/A
20 Christian 71 18,623 0 0 0 0 0 0.1 +0.1
21 Green 20 16,827 0 0 0 0 0 0.1 0.0
22 Health Concern 1 16,150 0 0 1 -1 0 0.1 0.0
23 Trade Unionist &amp Socialist 42 12,275 0 0 0 0 0 0.0 N/A
24 Independent - Bob Spink 1 12,174 0 0 1 -1 0 0.0 N/A
25 National Front 17 10,784 0 0 0 0 0 0.0 0.0
26 Buckinghamshire Campaign for Democracy 1 10,331 0 0 0 0 0 0.0 N/A
27 Monster Raving Loony 27 7,510 0 0 0 0 0 0.0 0.0
28 Socialist Labour 23 7,219 0 0 0 0 0 0.0 -0.1
29 Liberal 5 6,781 0 0 0 0 0 0.0 -0.1
30 Blaenau Gwent People's Voice 1 6,458 0 0 1 -1 0 0.0 -0.1
31 Christian Peoples 17 6,276 0 0 0 0 0 0.0 0.0
32 Mebyon Kernow 6 5,379 0 0 0 0 0 0.0 0.0
33 Lincolnshire Independents 3 5,311 0 0 0 0 0 0.0 N/A
34 Mansfield Independent Forum 1 4,339 0 0 0 0 0 0.0 N/A
35 Green (NI) 4 3,542 0 0 0 0 0 0.0 0.0
36 Socialist Alternative 3 3,298 0 0 0 0 0 0.0 0.0
37 Trust 2 3,233 0 0 0 0 0 0.0 N/A
38 Scottish Socialist 10 3,157 0 0 0 0 0 0.0 -0.1
39 People Before Profit 1 2,936 0 0 0 0 0 0.0 N/A
40 Local Liberals People Before Politics 1 1,964 0 0 0 0 0 0.0 N/A
41 Independent - Esther Rantzen 1 1,872 0 0 0 0 0 0.0 N/A
42 Alliance for Green Socialism 6 1,581 0 0 0 0 0 0.0 0.0
43 Social Democrat 2 1,551 0 0 0 0 0 0.0 N/A
44 Pirate 9 1,340 0 0 0 0 0 0.0 N/A
45 Communist 6 947 0 0 0 0 0 0.0 0.0
46 Democratic Labour 1 842 0 0 0 0 0 0.0 0.0
47 Democratic Nationalist Party 2 753 0 0 0 0 0 0.0 N/A
48 Workers Revolutionary 7 738 0 0 0 0 0 0.0 0.0
49 Peace 3 737 0 0 0 0 0 0.0 0.0
50 New Millennium Bean Party 1 558 0 0 0 0 0 0.0 0.0
51 - 29,687,604 650 - - - Turnout 65.1 -

Wednesday 28 November 2012

A Tutorial for ggplot2

Here is a quick ggplot2 tutorial from Isomorphismes from which I've completed the plots below


These two lines of code produce the same plot but show the differences between qplot and ggplot.

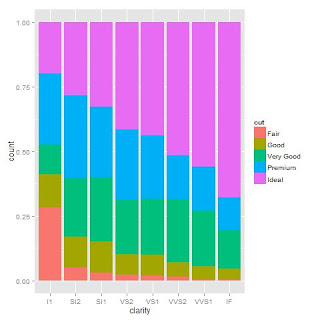
> qplot(clarity, data=diamonds, fill=cut, geom="bar")
> ggplot(diamonds, aes(clarity, fill=cut)) + geom_bar()


Data displayed with a continuous scale (top) and discrete scale (bottom) 

> qplot(wt, mpg, data=mtcars, colour=cyl)
> qplot(wt, mpg, data=mtcars, colour=factor(cyl))

I think it works better with different colours for the factors but you can change shapes too. 

>qplot(wt, mpg, data=mtcars, shape=factor(cyl))


Dodge is probably better for comparing data but lets face it fill is prettier

> qplot(clarity, data=diamonds, geom="bar", fill=cut, position="dodge")
>qplot(clarity, data=diamonds, geom="bar", fill=cut, position="fill")


Not with this data but this is the great plot to use for comparing over a time series.

> qplot(clarity, data=diamonds, geom="freqpoly", group=cut, colour=cut, position="identity")


Changed this one to get better smoothers. More info on that here.

> qplot(wt, mpg, data=mtcars, colour=factor(cyl), geom=c("smooth", "point"), method=glm)


When dealing with lots of data points overplotting is a common problem as you can see from the first plot above. 


> t.df <- data.frame(x=rnorm(4000), y=rnorm(4000))
> p.norm <- ggplot(t.df, aes(x,y))
> p.norm + geom_point()


There are 3 easy ways to deal with it. Make the points more transparent. Reduce the size of the points. Make the points hollow.

> p.norm + geom_point(alpha=.15)

> p.norm + geom_point(shape=".")

> p.norm + geom_point(shape=1)

This is also helpful for saving plots


> jpeg('rplot.jpg')
> plot(x,y)
> dev.off()
#Don't forget to turn it back on again
> dev.new()


Wednesday 14 November 2012

Data Munging in R


Whatever the fancy analysis or visualization carried out after work in R practically always starts with some data munging. Load the data, get rid of some columns you don't need, rename some of the other columns, check the data structure and make sure the data is in the format you want. This is pretty standard it can also be pretty baffling when you start to learn R's notoriously steep learning curve.

So to help out I've posted some of my code with notes. This was for data in CSV format and local was what I named the dataframe as the data referred to local councils. Remember if you don't know quite how to use a function eg gsub then try ?gsub and that'll bring up the help file which often contains helpful examples. So why not find some data of your own and try out out this yourself.


local<-read.table(file.choose(), header=T, sep=",")
head(local)
#tidy the dataframe up a bit. Removing unnecessary columns ect.
names(local)
local <- subset( local, select = -c(Old.ONS.code, ONS.code, Party.code ))
#check they have been removed
names(local)
# Rename some other columns by column number
> names(local)[1]<-"Name"
> names(local)[13]<-"CutPerHead"
> names(local)[14]<-"Benefit"
> names(local)[15]<-"YouthBenefit"
> names(local)[16]<-"DeprivationRanking"
> names(local)[17]<-"PublicSector"
> names(local)[18]<-"ChildPoverty"
#check they have been amended
names(local)
#check the structure of the dataframe
> str(local)
#Notice that the £ sign has got CutPerHead defined as a factor which we don't want
#As all the numbers are minus we can simply remove the all non numerical characters
local$CutPerHead <- gsub("[^0-9]", "", local$CutPerHead)
#Lets check that went OK
head(local$CutPerHead)
#Oops have removed the decimal point. Lets put it back in.
local$CutPerHead<-as.numeric(local$CutPerHead)
local$CutPerHead<-(local$CutPerHead/100)

Wednesday 18 April 2012

The 11th London Mayoral Twitter Poll


Click on pictures to enlarge

Poll findings
1)Oh Ken what are Labour going to do with you? You were recovering nicely from your tax troubles and then what do you do? Make the point that you thought a mass murdering terrorist who has already been shot shouldn't have been shot. I'm guessing Ken missed the class at professional politician school on message discipline. It's cost him a bad day on twitter and he really doesn't have a lot time to be having too many of those. Think I'm going back to predicting the race lean's Boris

2) Boris didn't have a brilliant day. His negatives went up but if your main rival is less popular than you then Boris will be the one taking comfort from today's poll. If there are as many people who love Boris as want to do terrible things because their transport is late then he could be alot worse off.

3)No real change on Brian and Jenny's figures today. Suggest one or both of them have a stand up blazing row with Boris with swearing and passion and loads of press convienently there to capture the moment for posterity. At least people would be talking about them. Will it help them win? Probably not but what have they got to lose?

4)Benita wins the Mary Poppins award AGAIN for best positive rating and lowest negative. Good coverage on Twitter. I noticed her followers followers had gone up over 4000. Then I thought to get 5% in this race Benita will need about 200,000 votes. What a poxy 5% for 200,000 votes! Yes I know that's rather alot even if you're getting coverage in the national press and have lots of Twitter activity. Not impossible but that just illustrates the reality of this massive election.


Results


    Candidate Pos11 Neut11 Neg11 Tot11 Pospercent11 Negpercent11
1    BorisCON   118    305   247   670           18           37
2      KenLAB   154    403   421   978           16           43
3 BrianLIBDEM    53    103    52   208           25           25
4  JennyGREEN    84    150    95   329           26           29
5  SiobhanIND   170    198    70   438           39           16
6   CarlosBNP     2     15     8    25            8           32

Tuesday 17 April 2012

The 10th London Mayoral Twitter Poll


Click on pictures to enlarge

Poll findings
1) The sentiment ratings aren't being very helpful today as really all the candidates aren't that far apart. But look at the negative poll graph what aren't you seeing that has been a solid featurewhen I started polling? Yes that massive Ken Livingstone colume in the negative poll. Infact for the last few days he negative ratings have been quite respectable. Not a clear election winning advantage but Ken'll just be glad he's not in position where the sentiment analysis clearly puts Boris in the lead. I think the EMA stuff helped Ken today. No I can't believe he's top of the positive ratings either.

2) Boris is treading along nicely. He'll not be too happy that Livingstone's volume went up alot more than his today. I think the election is still a toss up. It's leaned more to Boris over time but Ken's better rating over the last few days may give the Boris campaign cause for concern that they haven't yet sealed the deal.

3) Jenny and Siobhan both down a little bit on volume. So that late surge to pick them off the 2% rating they got from Yougov has been delayed somewhat it seems. Jenny will be happy her negatives have gone down too.  Not a bad day for Brian at all his positives not far off doubling and volume up a touch as well.

4)UKIP and the BNP failed to make the cut. AGAIN.


Results

   Candidate Pos10 Neut10 Neg10 Tot10 Pospercent10 Negpercent10
1    BorisCON   195    349   176   720           27           24
2      KenLAB   468    448   304  1220           38           25
3 BrianLIBDEM    86    122    70   278           31           25
4  JennyGREEN    49     89    42   180           27           23
5  SiobhanIND    92    151    53   296           31           18

Twitter vs Yougov


I've never said that polling Twitter is going to be a total replacement for traditional polling far from it but I do think it could be a useful addition is certain circumstances. So I was interested to see how yesterdays Twitter poll compared with the Yougov poll on the London Mayoral election that came out yesterday. I tested the correlation between the two and it came back at 89% quite a bit higher than I was expecting.


> a
[1] 45 40  7  2  2  1  3
> b
[1] 875 544 235 203 348  52   0
> cor(a,b)
[1] 0.8948858

Monday 16 April 2012

The 9th London Mayoral Election Twitter Poll


Click on pictures to enlarge

Poll findings
1) Well big changes today at least in how the poll is constructed. I wanted to put some kind of limit on the number of tweets that anyone tweeter could tweet that would be included in the analysis. I was going to keep secret to flummox anyone wanting to bias it. However during the course of coding I was able to find a solution that resulted in using tweeters that only mention a candidate only once. Go selecting data using logical conditions. Anyway I will see how this goes. Today it doesn't seemed to have changed from the normal pattern but obviously to volume reached has been lower.

2)Boris got more mentions but he was pretty much even with Ken on sentiment. So basically it's a toss up but slightly leaning to Boris.

3)Looking at the YouGov poll released today you've got a picture which show the big 2 out front and the others in something of a scrum at the bottom. I couldn't see a margin of error on there but expect with would have been something around +/- 3% so Paddick on 7% may feel better than Jones on 2% but Jones's +3% = 5% which is higher than Paddick's -3%  which = 4%.. I will do proper calculations to work out the correlation between my data and the result but at the moment it's not looking too bad even if the BorKen lead over the rest is understated.

4) Carlos has put in an appearance today. Suspect he got in the media somehow the tweets were mainly laughing at him. So we are getting near the prospect of a BNP mayor deporting himself.

5) Siobhan wins the Mary Poppins ward for highest positive rating & lowest negative. Though her figures aren't looking THAT different from the others. Jenny Jones shouldn't allow some American to use her name for chatshow reasons or at least get them to air the series after the election.


Results

    Candidate Pos9 Neut9 Neg9 Tot9 Pospercent9 Negpercent9
1    BorisCON  243   447  185  875          28          21
2      KenLAB  168   256  120  544          31          22
3 BrianLIBDEM   46   127   62  235          20          26
4  JennyGREEN   49    74   78  201          24          39
5  SiobhanIND  127   152   69  348          36          20
6   CarlosBNP    7    30   15   52          13          29

Sunday 15 April 2012

The 8th London Mayoral Election Twitter Poll


Poll findings
1) Well what a poll! As you can see there are two volume polls out today and no sentiment ones as yet. This is because I got a shock when I first did the poll as Siobhan Benita came out top in volume! Yes I know Boris and Ken's volumes are both down probably because it's the weekend but still it would have been the shock of the Twitter polling season. However on closer examination of the data it became clear that the total had been somewhat inflated by one tweeter so I'm introducing a limit to the tweets I count from each tweeter starting now.

I have applied it above with the adjusted graph so her volume figure falls from 756 to 483. I have checked the tweets of the the other candidates as well and no one else appears to be doing anything else similar. I don't think it was a deliberate attempt to skew the poll because it would have been the most rubbish attempt ever. 

2) In other news Ken's negatives have fallen below Boris's for the first time. This isn't going to totally undo the damage of recent times for Ken but it's an indication that the story is moving on.

3) Even with the adjustment Benita still got a higher volume than Ken for the first time today.

4)Brian and Jenny steady as they go I think.

5) UKIP and the BNP fail to make the cut. AGAIN.


Results

The adjusted figures


    Candidate Pos8 Neut8 Neg8 Tot8 
1       Ken Lab   95   232  125  452                   
2     Boris Con  158   266  224  648                   
3   Jenny Green   51    69   55  175           
4 Brian Lib Dem   61   111   67  239                  
5   Siobhan Ind                  483 


How does the poll work 

Tweets are collected from Twitter and then counted to give the volume figures and then they are classified by the sentiment package which is an addition to the R programming language I use for this. They're classified based on the content of the tweet. So something like "Love @mayoroflondon he's brilliant" would end up in the positive pile while "I'm going to rip Boris Johnson's ugly evil head off if no bus in 30secs" would end up in the negative pile. If it's not quite to obvious then there's the neutral category.

Progress so far....

 Click to enlarge.

In response to public demand he's a chart of the volume of tweets each candidate has got over the last week I've been getting data. I also be doing the positive and negative sentiment figures at some point as well.

Obviously the Lib Dems wouldn't admit it but they can't be happy being bottom for 5 of the last 7 days. Given that one of the other day's was Paddick's manifesto launch  Neither will the Greens be happy to be beneth Benita every day. Then comes the key question both for this experiment and the election how much do tweets translate into votes or at least registering on proper opinion polls with correctly weighted samples?

There does appear to be something of a pattern emerging with the top 2 somewhat correllated and the bottom 3 similarly bound together. We'll see if that continues next week.

My methodology does favour the smaller parties so I suspect Ken and Boris are quite a bit further ahead in reality but I get twitter handles and full names rather than first names so this shrinks the gap between the politicians on first name terms with the electorate as oppossed to those who aren't even famous in their own household. This is for two reasons 1) capacity the API I use searches for a max of 1500 tweets per search term if I search for Ken instead of Ken Livingstone then I would be much more likely to reach full capacity and miss tweets. 2) There are quite a few other Ken and Boris's in the world so if it's full names I'm searching for at least I know I'm getting the right ones.

The other two candidates didn't feature on the graph as it was hard enough doing it with data where they weren't any gaps.

R\ggplot2\data stuff

This was something of a pig to do but a good learning excercise nontheless. Things to note for the future. The date has to be the correct date format. Whatever you do don't spend hours faffing about making things into factors or as.integers or as.characters or any of that gubbins. You want as.Date.

Need to work out how to select the colours.

Data need to be in the sort of format you see below


Candidate Date Volume
Boris 08/04/12 489
Ken 08/04/12 569
Siobhan 08/04/12 333
Jenny 08/04/12 303
Brian 08/04/12 164
Boris 09/04/12 1541
Ken 09/04/12 839
Siobhan 09/04/12 271
Jenny 09/04/12 183

Saturday 14 April 2012

The 7th London Mayoral Election Twitter Poll


Poll findings
1) Has peace and harmony broken out on the London front? Not quite but Ken, Jenny, Brian and Siobhan all have better percentage figures for both positive and negative today. Boris is 2% better off on his negative but 4% down on his positive so not a big change there.

2) Volume of tweets was down alot especially Boris and Ken but Siobhan's also fell a little. Suspect it's because it's a Saturday but Jenny's and Brian's volume increased. I would put this down to hustings today I think there was one organised by Stonewall and another Youth one. So that means less time for Boris and Ken to get on the telly hence their figures go down. Jenny and Brian get equal billing and hence see increases in their total. Well that's my theory anyway.

3) Ken has had a difficult week on the trail but is he starting to turn the corner? Yesterday the gap between Boris and Ken's negative percentage was 18% ie 39 vs 21 today it's 25 vs 18. If and it's a big if this improvement continues there starts to be a realistic argument to move the race back from leans Boris to toss-up between the two.

4) There's going to be a Yougov poll on the London Mayoral race on Monday that'll be a big day for the Benita campaign. If she fails to register again like ComRes than it's going to look like a campaign in a social media bubble with little resonance on the ground. But it'll be worth looking at the question as the ComRes one disadvantaged the smaller campaigns by not mentioning their candidate name in the question. Today she's won the Mary Poppins award for the highest positive rating and the lowest negative one as well.

5) UKIP an the BNP failed to make the cut. AGAIN. So clearly not putting the effort in.

How does the poll work 

Tweets are collected from Twitter and then counted to give the volume figures and then they are classified by the sentiment package which is an addition to the R programming language I use for this. They're classified based on the content of the tweet. So something like "Love @mayoroflondon he's brilliant" would end up in the positive pile while "I'm going to rip Boris Johnson's ugly evil head off if no bus in 30secs" would end up in the negative pile. If it's not quite to obvious then there's the neutral category.


Results


      Candidate Pos7 Neut7 Neg7 Tot7 Negpercent7 Pospercent7
1       Ken Lab  309   539  276 1124          25          27
2     Boris Con  202   349  129  680          19          30
3   Jenny Green  165   321   92  578          16          29
4 Brian Lib Dem  123   206   64  393          16          31
5   Siobhan Ind  224   297   81  602          13          37

Friday 13 April 2012

The 6th London Mayoral Twitter Poll


Poll findings:
1) Another day on the campaign trail gone and Boris will be doing most of the smiling tonight. Not only did he get a bounce from banning the gay cure bus adverts his main rivals negatives are sticking out like a sore thumb. Again.

2) If I was to explain this apparent voter preference for Boris over Ken. I would say this. There are people on the left who hate Boris and the're people on the right who hate Ken but what I think the results are showing is that there is something of a likeability gap between Ken and Boris amongst people who aren't interested in politics. This is a problem for Ken. I suggest a cute puppy accompany him everywhere.

3)  Another good result for Siobhan Benita 3rd again in volume. Her negatives seemed to have joined the normal political race but she's still the most benignly viewed candidate on Twitter. I think my methodology does favour her a little bit at least compared to the ComRes poll question that didn't mention her. Where's she going to end up? I think the comedy candidate choice by the BNP is going to put them last. If your supporters are anti immigrant giving them an immigrant to vote for unless I'm missing something here isn't going to get them out to vote in vast numbers. Then I think you've got a band going from one of the candidates having a bad election on 3% to about 10% at the other end. In this scrum go UKIP, Greens, Lib Dems and Benita. Who comes out top? Who comes out bottom? Difficult to say but if she can keep bring home these impressive Twitter stats the chances of getting nearer the top of that band have got to increase.


4)
Jenny stayed much the same as yesterday but Brian seems to have dropped down a plughole in volume terms. Some way 5th can't be a comfortable place for Mr Paddick to storm to victory from


5) A rare appearence for Lawrence Webb of UKIP in the Twitter poll he had quite a few mentions of him going on various radio progammes and assorted media appearence and these were mostly classified as neutral. Sample size is really to small to read anything into it.


      Candidate Pos6 Neut6 Neg6 Tot6 Negpercent6 Pospercent6
1       Ken Lab  423  1043  930 2396          39          18
2     Boris Con  690   893  429 2012          21          34
3   Jenny Green   72   230   88  390          23          18
4 Brian Lib Dem   32   109   45  186          24          17
5   Siobhan Ind  239   413  176  828          21          29
6 Lawrence UKIP    0    52    4   56           7           0

Black Britain Decides on Boris

Click to enlarge the picture

Last night was the Black Britain Decides Mayoral Hustings put on by "a coalition of Black leaders including Church leaders, business leaders, activists, faith groups". It used the hashtag #blackbritaindecides. I wanted to assess the audience reaction to Boris. So I scraped all the tweets that mentioned #blackbritaindecides and Boris there were 474. So there was certainly reaction to him. As you can see above it was mainly negative. Indeed this is the highest negative reaction on any of the polls I've done.

One of the things that hold Boris back in the election is his relationship with London's Black community. I don't think it's ever been that great. That won't have been helped by only mentioning Blacks in the crime section of his new manifesto. This is an error on Boris's part. If he could bring at least a decent chunk of Black votes over to his side he'd walk the election.

#blackbritaindecides Boris Sentiment Figures

  Sentiment Percent
1  Positive      11
2   Neutral      31
3  Negative      57

Adds up to 99% due to rounding.

Thursday 12 April 2012

The 5th London Mayoral Twitter Poll

Poll findings

1) Ken top of the negatives, bottom of the positives today. Ok his negatives are lower than yesterday and his positives are higher but still Boris is probably happier with his results than Ken is with his own. Overall I would say it's still all to play for but I'd delve into the lexicon of the American political tipster and say London is a district that is slightly leaning towards Boris at the moment at least on Twitter. Ken will have been cheered up with Labour's performance in the East Finchley local by election and if the grannies of London who are unrepresented on this new medium take umbridge at the granny tax then Boris could come a cropper but I think Boris has opened up a bridgeable clink of light between the pair of them. 

2) Siobhan Benita top of the positives, bottom of the negatives. Ken would kill for her ratings but her volume is down and has dropped behind the Lib Dems which is never to great accolade for anyone in politics at the moment.


3) Brian Paddick may have the second highest negative ratings after Ken but at least the 2nd time "celebrity" candidate has got more volume than someone who chucked her job in a short while ago.

4) Boris got a mention from virtually Royalty herself @Queen_UK today and on Russell Howard's good news. Quite a few people declared their love for Boris Johnson as he's funny. Humour and love that's a powerful combination.


5) Have decided UKIP and BNP must think Twitter is a foreign invader and must be repelled by not being mentioned on it if at all possible. Given the low bar they have to cross to be featured (20 proper tweets) they or their supporters if they have any clearly aren't putting in the effort.


      Candidate Pos5 Neut5 Neg5 Tot5 Negpercent5 Pospercent5
1       Ken Lab  418  1018  726 2162          34          19
2     Boris Con  707   853  521 2081          25          34
3   Jenny Green   78   213   92  383          24          20
4 Brian Lib Dem  189   284  203  675          30          28
5   Siobhan Ind  202   292   82  576          14          35

The Day After The Night Before & Other Things

#mayordebate

Click on the picture to enlarge it.

There was a time when event organisers had very little access to information about the reaction of participants to their events or indeed the overall impact of them. Social media is helping to change that. Take this years Britain's Got Talent where they put an individual hashtag on screen for each act. Simon Cowell or more likely one of Simon Cowell's more technically capable underlings is able to gather up all this information and see which act the public like most.

Here are some of the tweets containing the #mayordebate hashtag from the big Mayoral Debate put on by The Standard each bar represents a minute you can see at the height of the debate people where tweeting about it up to 40 times a minute.

There are other things that could be done with the data:
  • Sentiment analysis can be used to discover reaction
  • This can be divided over time to find which were the popular/unpopular bits
  • Text mining can be used with sentiment classified tweets to find out what words were associated with positive/negative tweets to find out what people liked about something.
  • You can find out who's tweeting about your event/issue the most and with sentiment analysis you can find out who you're biggest supporters and dectractors are.
  • Once you start gathering data then you can compare over time. Was it more popular than last year? Did the same Tweeters like it again this year as last ? Did the effort you put into solving a problem you found last year pay off this year? 
One of the great things about this kind of data analysis is it's scalability. You could use it for something relatively small like a public meeting going up the scale a music festival or reaction to a natural disaster or the Olympics. 

Big reads for big data

This is my new favourite article it's called Big Data, BAD preditictions, and How to Improve It? and you can read it here

mySociety plug

In other news the good people of mySociety are having a data day some point in the not too distant future. If you don't know about mySociety and are interested in data or democracy or indeed both you really should. Here's the blurb.

mySociety is the organisation behind such websites as WhatDoTheyKnow, TheyWorkForYou, FixMyStreet and FixMyTransport. Each of these sites generates a large amount of potentially newsworthy data every day. Now we'd like to invite anyone with an interest in data journalism - or mySociety more generally - to join our team for a day's workshop in central London.

We'll collaboratively discover the stories that will make the news - you tell us the data you'd like to see, and we'll do the hacking. Here are just a few examples of stories waiting to be mined - but with your input, we expect to discover many more. - WhatDoTheyKnow is our Freedom of Information site. It contains archives of over 100,000 FOI requests. Which bodies have received the most requests? And what are the most common concerns of those making them? - TheyWorkForYou keeps tabs on the nation's representatives, and publishes a complete record of Hansard.

Which are the most frequently spoken words in Parliament?

Which MP has uttered the largest share of them? - FixMyStreet allows users to report problems such as potholes to the relevant local authority.

Which council has the highest number of reports per capita?

What are the seasonal trends in problem types? - FixMyTransport makes it easy to contact the operators when there's a problem with your public transport journey.

What are the major issues in Britain's public transport today?

Which routes are the trouble hotspots?

Check here for more details.

Wednesday 11 April 2012

The 4th London Mayoral Twitter Poll


 Poll findings
1) Well it's all been happening today. Ken released a video and cried getting coverage in the national press which sees his volume figures hit the roof and then there was the debate!His ratings has worsened a little bit more than Boris's 
 
2) Boris's volume hardly changed from yesterday and his figures are a little worse but really not a lot of change.
 
3) For people who wanted to prove ComRes wrong tonights figures are good news for Siobhan Benita as she got the highest positive rating and lowest negative and her volume grew again even though she was excluded from the debate. Now comfortably third she also got more positive mentions than Boris Johnson. Her problem is numbers to get 5% and get her deposit back she need roughly 200,000 votes. Now a 1000+ tweets is a great performance that the Lib Dems and Greens can't match but she's going to need more than twitter to breakthrough electorally in what is a VAST electorate.
 
4) As for the Lib Dems and Greens volume up probably because of the debate but not a lot of change in sentiment. Brian performed a bit worse today but then yesterday was his manifesto launch which is as close as you generally get in politics to a look at me aren't I and my policies fantastic day so some decline was to be expected.
 
5) UKIP failed to make the cut and the BNP well what can you say the're nowhere at least not round here anyway perhaps they're big in Uruguay or something.
 
 
 How does this poll work?
 
 
      Candidate Pos4 Neut4 Neg4 Tot4 Pospercent4 Negpercent4
1       Ken Lab  469  1242 1190 2901          16          41
2     Boris Con  295   604  516 1415          21          36
3   Jenny Green  145   413  234  782          19          30
4 Brian Lib Dem  154   269  184  604          25          30
5   Siobhan Ind  340   555  218 1113          31          20
6    Carlos BNP    5    20   10   35          14          29

Tuesday 10 April 2012

The 3rd London Mayoral Election Twitter Poll

Click on pictures to enlarge.

Poll findings
1) Manifesto launches are a bit like Birthdays for political candidates except they hand out the presents I was really happy I was able to pick up on this is Brian Paddick's tweeter presence. Volume up, positive tweets up, negative tweets down. This is Mr Paddicks best poll by some way.

2) Perhaps the tax storm is dying down as Ken's negative rating is down quite strongly. The fact that he's level pegging on sentiment, if not quite on volume, is something of a vindication as the ComRes poll had them not too far apart. Boris's stats are roughly back where they were two days ago.

3) What to do about Siobhan Benita? That is the question that will be taxing the mind of many involved in the London Mayoral Election. ComRes had her nowhere. Twitter says different. We'll see who's right on election day. I don't think she has the kind of ground operation that the main parties have and if she starts to pose a threat to the other candidates she can expect a rougher ride than she's had up to now. ComRes doesn't mention her name in the polling question which they do for the 3 main party candidate's which could be a source of bias. But Twitter is well Twitter. I'd expect her to get 3-5% at the moment but if she does keep getting momentum then that could increase.

4) Jenny Jones has polled a little worse today but it's not a huge variation. Her volume was up slightly but she is by some way behind the others who also made the cut for our poll.


5) Talking of the cut UKIP and the BNP didn't make it today. Although it was good to find @UKIPWebb4London and we look forward to mentioning him more often should they get over 20 proper mentions. Not a high bar by anymeans.

Free free to compare to yesterdays poll which you can find here

How does the poll work 

Tweets are collected from Twitter and then counted to give the volume figures and then they are classified by the sentiment package which is an addition to the R programming language I use for this. They're classified based on the content of the tweet. So something like "Love @mayoroflondon he's brilliant" would end up in the positive pile while "I'm going to rip Boris Johnson's ugly evil head off if no bus in 30secs" would end up in the negative pile. If it's not quite to obvious then there's the neutral category.

Poll figures


      Candidate Pos3 Neut3 Neg3 Tot3 Pospercent3 Negpercent3
1       Ken Lab  244   648  386 1278          19          30
2     Boris Con  259   681  407 1347          19          30
3   Jenny Green   63    80   58  201          31          29
4 Brian Lib Dem  200   202   86  488          41          18
5   Siobhan Ind  166   205   55  426          39          13


Where is Boris's 100,000 strong Twitter Army?

I ask the question after reading this interesting interview on the Standard website. In the interview given to Pippa Crerar  Boris's campaign manager Lynton Crosby states:

"This time the huge supporters’ army, which has swelled to more than 100,000, is key. Each of the “captains” runs 25 other volunteers, leafleting, door-knocking and tweeting in support of the Mayor. There are tens of thousands more supporters online."

I'd like to ask where are these supporters because they're not tweeting that often if there are a 10's of thousands? Perhaps the definition of "supporter" is being rather stretched here perhaps it's a facebook like or an old email address given in 2007. I understand there's an election on but the evidence really doesn't support the claim.

Another interesting point Crosby made that the campaign has 347 "ward" captains these must be bigger than the normal wards in London local government or they're only targeting some areas as there are alot more wards in London than that.

In other news I've found the twitter account of the UKIP candidate. Which is handy as polling will commence shortly.


Monday 9 April 2012

The 2nd London Mayoral Election Twitter Poll


Click on pictures to enlarge.


Poll findings
1) Boris had a good day today he got loads more tweets than anybody else. Infact more than everyone else combined. His positive rating hasn't really changed 22% today rather than 21% over Saturday and Sunday but his negative ratings came down from 28% to 15%. Less than a third of his main rivals.

2) Ken had a bad day he got more tweets but they were more negative 50% as opposed to 40% on Sat & Sun. Numerically Ken's positive tweets have hardly changed but they form a smaller %.

3) Siobhan Benita got more tweets than either the Greens or the Lib Dems and has grown in daily volume. She's wrestled the mantle of having the largest % of positive tweets from Jenny Jones. There is definately some momentum here.

4) Jenny Jones had a few more tweets today but the essentially not much has changed in the Twittersphere's positive view of her campaign.

5) Brian Paddick has both negative and positive %'s down as he's daily volume is slightly up. Although 5th out of 6 isn't anything to write home about.

6) Some people actually mentioned the BNP so they've made the poll cut with a whole 22 tweets. Not much should be read into the figures as the sample size is so small. Not expecting them to get anywhere.


7) Overall I think Ken's troubles means there is some leakage of the anti Boris vote to the Independent Siobhan Benita. Boris is sitting pretty even if he need to find £5million for homeless charities and  Chris Addison called him an idiot. Strangly I don't think that's going to hurt him too much. I think Boris is viewed something along the lines of they're all idiots but he's funny and his our idiot. Otherwise a relatively quiet day on the trail.

How does this poll work?

This poll is based on tweets made on the 9th April 2012 up until 10pm


     Candidate Positive2 Neutral2 Negative2 totalpoll2
1       Ken Lab       138      284       417        839
2     Boris Con       338      969       234       1541
3   Jenny Green        63       74        46        183
4 Brian Lib Dem        16       54        31        101
5   Siobhan IND       110      113        48        271
6    Carlos BNP         2       14         6         22
  Positive1 Neutral1 Negative1 Totalpoll1 Pospercent2
1       130      210       229        569          16
2       101      252       136        489          22
3        98      146        65        309          34
4        33       71        60        164          16
5        87      179        67        333          41
6         0        0         0          0           9
  Negpercent2 Negpercent1 Pospercent1
1          50          40          23
2          15          28          21
3          25          21          32
4          31          37          20
5          18          20          26
6          27         NaN         NaN