Wednesday, 28 November 2012

A Tutorial for ggplot2

Here is a quick ggplot2 tutorial from Isomorphismes from which I've completed the plots below


These two lines of code produce the same plot but show the differences between qplot and ggplot.

> qplot(clarity, data=diamonds, fill=cut, geom="bar")
> ggplot(diamonds, aes(clarity, fill=cut)) + geom_bar()


Data displayed with a continuous scale (top) and discrete scale (bottom) 

> qplot(wt, mpg, data=mtcars, colour=cyl)
> qplot(wt, mpg, data=mtcars, colour=factor(cyl))

I think it works better with different colours for the factors but you can change shapes too. 

>qplot(wt, mpg, data=mtcars, shape=factor(cyl))


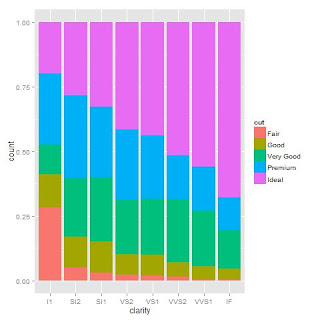
Dodge is probably better for comparing data but lets face it fill is prettier

> qplot(clarity, data=diamonds, geom="bar", fill=cut, position="dodge")
>qplot(clarity, data=diamonds, geom="bar", fill=cut, position="fill")


Not with this data but this is the great plot to use for comparing over a time series.

> qplot(clarity, data=diamonds, geom="freqpoly", group=cut, colour=cut, position="identity")


Changed this one to get better smoothers. More info on that here.

> qplot(wt, mpg, data=mtcars, colour=factor(cyl), geom=c("smooth", "point"), method=glm)


When dealing with lots of data points overplotting is a common problem as you can see from the first plot above. 


> t.df <- data.frame(x=rnorm(4000), y=rnorm(4000))
> p.norm <- ggplot(t.df, aes(x,y))
> p.norm + geom_point()


There are 3 easy ways to deal with it. Make the points more transparent. Reduce the size of the points. Make the points hollow.

> p.norm + geom_point(alpha=.15)

> p.norm + geom_point(shape=".")

> p.norm + geom_point(shape=1)

This is also helpful for saving plots


> jpeg('rplot.jpg')
> plot(x,y)
> dev.off()
#Don't forget to turn it back on again
> dev.new()


Wednesday, 14 November 2012

Data Munging in R


Whatever the fancy analysis or visualization carried out after work in R practically always starts with some data munging. Load the data, get rid of some columns you don't need, rename some of the other columns, check the data structure and make sure the data is in the format you want. This is pretty standard it can also be pretty baffling when you start to learn R's notoriously steep learning curve.

So to help out I've posted some of my code with notes. This was for data in CSV format and local was what I named the dataframe as the data referred to local councils. Remember if you don't know quite how to use a function eg gsub then try ?gsub and that'll bring up the help file which often contains helpful examples. So why not find some data of your own and try out out this yourself.


local<-read.table(file.choose(), header=T, sep=",")
head(local)
#tidy the dataframe up a bit. Removing unnecessary columns ect.
names(local)
local <- subset( local, select = -c(Old.ONS.code, ONS.code, Party.code ))
#check they have been removed
names(local)
# Rename some other columns by column number
> names(local)[1]<-"Name"
> names(local)[13]<-"CutPerHead"
> names(local)[14]<-"Benefit"
> names(local)[15]<-"YouthBenefit"
> names(local)[16]<-"DeprivationRanking"
> names(local)[17]<-"PublicSector"
> names(local)[18]<-"ChildPoverty"
#check they have been amended
names(local)
#check the structure of the dataframe
> str(local)
#Notice that the £ sign has got CutPerHead defined as a factor which we don't want
#As all the numbers are minus we can simply remove the all non numerical characters
local$CutPerHead <- gsub("[^0-9]", "", local$CutPerHead)
#Lets check that went OK
head(local$CutPerHead)
#Oops have removed the decimal point. Lets put it back in.
local$CutPerHead<-as.numeric(local$CutPerHead)
local$CutPerHead<-(local$CutPerHead/100)

Wednesday, 18 April 2012

The 11th London Mayoral Twitter Poll


Click on pictures to enlarge

Poll findings
1)Oh Ken what are Labour going to do with you? You were recovering nicely from your tax troubles and then what do you do? Make the point that you thought a mass murdering terrorist who has already been shot shouldn't have been shot. I'm guessing Ken missed the class at professional politician school on message discipline. It's cost him a bad day on twitter and he really doesn't have a lot time to be having too many of those. Think I'm going back to predicting the race lean's Boris

2) Boris didn't have a brilliant day. His negatives went up but if your main rival is less popular than you then Boris will be the one taking comfort from today's poll. If there are as many people who love Boris as want to do terrible things because their transport is late then he could be alot worse off.

3)No real change on Brian and Jenny's figures today. Suggest one or both of them have a stand up blazing row with Boris with swearing and passion and loads of press convienently there to capture the moment for posterity. At least people would be talking about them. Will it help them win? Probably not but what have they got to lose?

4)Benita wins the Mary Poppins award AGAIN for best positive rating and lowest negative. Good coverage on Twitter. I noticed her followers followers had gone up over 4000. Then I thought to get 5% in this race Benita will need about 200,000 votes. What a poxy 5% for 200,000 votes! Yes I know that's rather alot even if you're getting coverage in the national press and have lots of Twitter activity. Not impossible but that just illustrates the reality of this massive election.


Results


    Candidate Pos11 Neut11 Neg11 Tot11 Pospercent11 Negpercent11
1    BorisCON   118    305   247   670           18           37
2      KenLAB   154    403   421   978           16           43
3 BrianLIBDEM    53    103    52   208           25           25
4  JennyGREEN    84    150    95   329           26           29
5  SiobhanIND   170    198    70   438           39           16
6   CarlosBNP     2     15     8    25            8           32

Tuesday, 17 April 2012

The 10th London Mayoral Twitter Poll


Click on pictures to enlarge

Poll findings
1) The sentiment ratings aren't being very helpful today as really all the candidates aren't that far apart. But look at the negative poll graph what aren't you seeing that has been a solid featurewhen I started polling? Yes that massive Ken Livingstone colume in the negative poll. Infact for the last few days he negative ratings have been quite respectable. Not a clear election winning advantage but Ken'll just be glad he's not in position where the sentiment analysis clearly puts Boris in the lead. I think the EMA stuff helped Ken today. No I can't believe he's top of the positive ratings either.

2) Boris is treading along nicely. He'll not be too happy that Livingstone's volume went up alot more than his today. I think the election is still a toss up. It's leaned more to Boris over time but Ken's better rating over the last few days may give the Boris campaign cause for concern that they haven't yet sealed the deal.

3) Jenny and Siobhan both down a little bit on volume. So that late surge to pick them off the 2% rating they got from Yougov has been delayed somewhat it seems. Jenny will be happy her negatives have gone down too.  Not a bad day for Brian at all his positives not far off doubling and volume up a touch as well.

4)UKIP and the BNP failed to make the cut. AGAIN.


Results

   Candidate Pos10 Neut10 Neg10 Tot10 Pospercent10 Negpercent10
1    BorisCON   195    349   176   720           27           24
2      KenLAB   468    448   304  1220           38           25
3 BrianLIBDEM    86    122    70   278           31           25
4  JennyGREEN    49     89    42   180           27           23
5  SiobhanIND    92    151    53   296           31           18

Twitter vs Yougov


I've never said that polling Twitter is going to be a total replacement for traditional polling far from it but I do think it could be a useful addition is certain circumstances. So I was interested to see how yesterdays Twitter poll compared with the Yougov poll on the London Mayoral election that came out yesterday. I tested the correlation between the two and it came back at 89% quite a bit higher than I was expecting.


> a
[1] 45 40  7  2  2  1  3
> b
[1] 875 544 235 203 348  52   0
> cor(a,b)
[1] 0.8948858

Monday, 16 April 2012

The 9th London Mayoral Election Twitter Poll


Click on pictures to enlarge

Poll findings
1) Well big changes today at least in how the poll is constructed. I wanted to put some kind of limit on the number of tweets that anyone tweeter could tweet that would be included in the analysis. I was going to keep secret to flummox anyone wanting to bias it. However during the course of coding I was able to find a solution that resulted in using tweeters that only mention a candidate only once. Go selecting data using logical conditions. Anyway I will see how this goes. Today it doesn't seemed to have changed from the normal pattern but obviously to volume reached has been lower.

2)Boris got more mentions but he was pretty much even with Ken on sentiment. So basically it's a toss up but slightly leaning to Boris.

3)Looking at the YouGov poll released today you've got a picture which show the big 2 out front and the others in something of a scrum at the bottom. I couldn't see a margin of error on there but expect with would have been something around +/- 3% so Paddick on 7% may feel better than Jones on 2% but Jones's +3% = 5% which is higher than Paddick's -3%  which = 4%.. I will do proper calculations to work out the correlation between my data and the result but at the moment it's not looking too bad even if the BorKen lead over the rest is understated.

4) Carlos has put in an appearance today. Suspect he got in the media somehow the tweets were mainly laughing at him. So we are getting near the prospect of a BNP mayor deporting himself.

5) Siobhan wins the Mary Poppins ward for highest positive rating & lowest negative. Though her figures aren't looking THAT different from the others. Jenny Jones shouldn't allow some American to use her name for chatshow reasons or at least get them to air the series after the election.


Results

    Candidate Pos9 Neut9 Neg9 Tot9 Pospercent9 Negpercent9
1    BorisCON  243   447  185  875          28          21
2      KenLAB  168   256  120  544          31          22
3 BrianLIBDEM   46   127   62  235          20          26
4  JennyGREEN   49    74   78  201          24          39
5  SiobhanIND  127   152   69  348          36          20
6   CarlosBNP    7    30   15   52          13          29

Sunday, 15 April 2012

The 8th London Mayoral Election Twitter Poll


Poll findings
1) Well what a poll! As you can see there are two volume polls out today and no sentiment ones as yet. This is because I got a shock when I first did the poll as Siobhan Benita came out top in volume! Yes I know Boris and Ken's volumes are both down probably because it's the weekend but still it would have been the shock of the Twitter polling season. However on closer examination of the data it became clear that the total had been somewhat inflated by one tweeter so I'm introducing a limit to the tweets I count from each tweeter starting now.

I have applied it above with the adjusted graph so her volume figure falls from 756 to 483. I have checked the tweets of the the other candidates as well and no one else appears to be doing anything else similar. I don't think it was a deliberate attempt to skew the poll because it would have been the most rubbish attempt ever. 

2) In other news Ken's negatives have fallen below Boris's for the first time. This isn't going to totally undo the damage of recent times for Ken but it's an indication that the story is moving on.

3) Even with the adjustment Benita still got a higher volume than Ken for the first time today.

4)Brian and Jenny steady as they go I think.

5) UKIP and the BNP fail to make the cut. AGAIN.


Results

The adjusted figures


    Candidate Pos8 Neut8 Neg8 Tot8 
1       Ken Lab   95   232  125  452                   
2     Boris Con  158   266  224  648                   
3   Jenny Green   51    69   55  175           
4 Brian Lib Dem   61   111   67  239                  
5   Siobhan Ind                  483 


How does the poll work 

Tweets are collected from Twitter and then counted to give the volume figures and then they are classified by the sentiment package which is an addition to the R programming language I use for this. They're classified based on the content of the tweet. So something like "Love @mayoroflondon he's brilliant" would end up in the positive pile while "I'm going to rip Boris Johnson's ugly evil head off if no bus in 30secs" would end up in the negative pile. If it's not quite to obvious then there's the neutral category.